
SharanSMenon
Someone who likes AI and Programming
Time series in Prophet
Published Jan 19, 2020
Share
Prophet is a tool published by facebook that can be used for forecasting data like time series.
We will be forecasting stock data for apple today. It can be tough to predict stock data because it is so noisy.
Getting the data
Head to this link and download the csv file by clicking the “Download Data” link on the page. It is a little hard to spot.
Installing Prophet
pip install fbprophet
Just run the following command to install Prophet. Make sure that you have python installed and you should run this code in a Jupyter Notebook (or jupyterlab).
Using Prophet
Importing libraries
import pandas as pd
from fbprophet import Prophet
We are loading the csv file here. We call it AAPL.csv. You should have downloaded this data in the earlier section titled “Getting the data”
df = pd.read_csv("AAPL.csv")
df.head()
| Date | Open | High | Low | Close | Adj Close | Volume | |
|---|---|---|---|---|---|---|---|
| 0 | 2015-01-20 | 107.839996 | 108.970001 | 106.500000 | 108.720001 | 99.893822 | 49899900 |
| 1 | 2015-01-21 | 108.949997 | 111.059998 | 108.269997 | 109.550003 | 100.656441 | 48575900 |
| 2 | 2015-01-22 | 110.260002 | 112.470001 | 109.720001 | 112.400002 | 103.275063 | 53796400 |
| 3 | 2015-01-23 | 112.300003 | 113.750000 | 111.529999 | 112.980003 | 103.807991 | 46464800 |
| 4 | 2015-01-26 | 113.739998 | 114.360001 | 112.800003 | 113.099998 | 103.918228 | 55615000 |
We have to rename the columns to ds and y so that we can train it using Prophet.
d2 = df[["Date", "High"]]
d2.columns = ["ds", "y"]
d2.head()
| ds | y | |
|---|---|---|
| 0 | 2015-01-20 | 108.970001 |
| 1 | 2015-01-21 | 111.059998 |
| 2 | 2015-01-22 | 112.470001 |
| 3 | 2015-01-23 | 113.750000 |
| 4 | 2015-01-26 | 114.360001 |
We are just training prophet on our dataframe just like that.
m = Prophet() # We train Prophet here
m.fit(d2)
Predicting the future
future = m.make_future_dataframe(periods=365)
future.tail() # Goes up to 01-16-2021
| ds | |
|---|---|
| 1619 | 2021-01-12 |
| 1620 | 2021-01-13 |
| 1621 | 2021-01-14 |
| 1622 | 2021-01-15 |
| 1623 | 2021-01-16 |
We actually predict the future in the following cell.
forecast = m.predict(future)
forecast[['ds', 'yhat', 'yhat_lower', 'yhat_upper']].tail()
| ds | yhat | yhat_lower | yhat_upper | |
|---|---|---|---|---|
| 1619 | 2021-01-12 | 421.165426 | 295.498040 | 559.937322 |
| 1620 | 2021-01-13 | 421.603917 | 300.204687 | 557.991950 |
| 1621 | 2021-01-14 | 421.868835 | 296.781987 | 559.755712 |
| 1622 | 2021-01-15 | 422.064133 | 296.079828 | 559.776385 |
| 1623 | 2021-01-16 | 419.793294 | 293.032000 | 559.370520 |
# (Optional)
%config InlineBackend.figure_format = 'retina'
# Makes the quality of the figure better.
Here is a plot of the figure.
fig1 = m.plot(forecast)
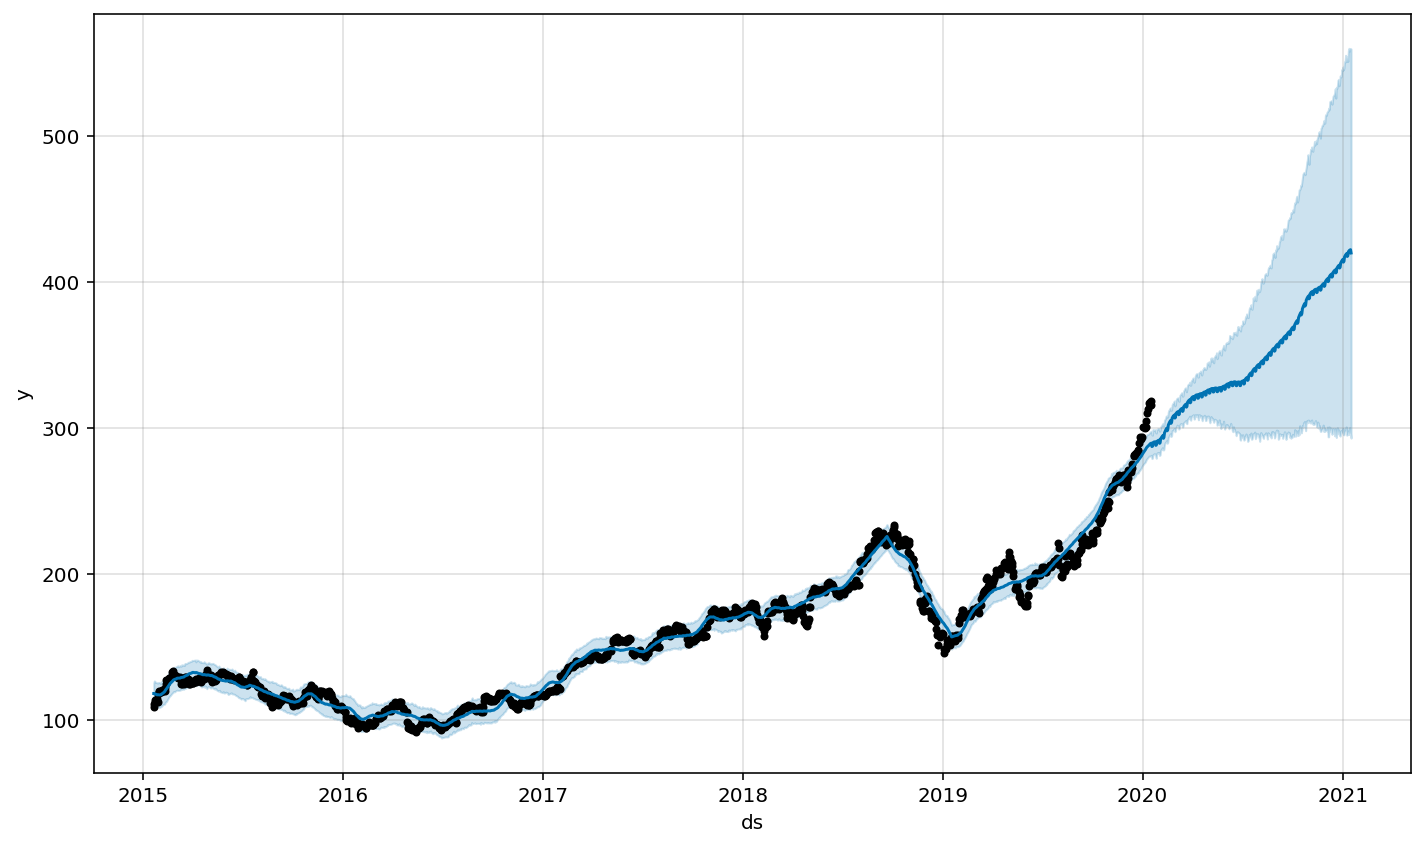
And there you have it! We used facebook’s Prophet tool to train a forecaster model and we forecasted future prices of apple’s stock with it.